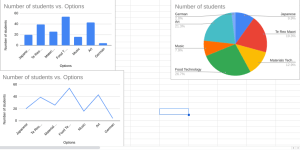
For maths our level 4 group was learning how to make chart. We were comparing the subject choices for the kids to do and how many students wanted which. The highest vote was for food technology. The reason we had to create graphs was because it was more eye catching.